
Click “Dashboard” on the WEB page to check the system information includes network status, system status, resources and logs.
Introduction
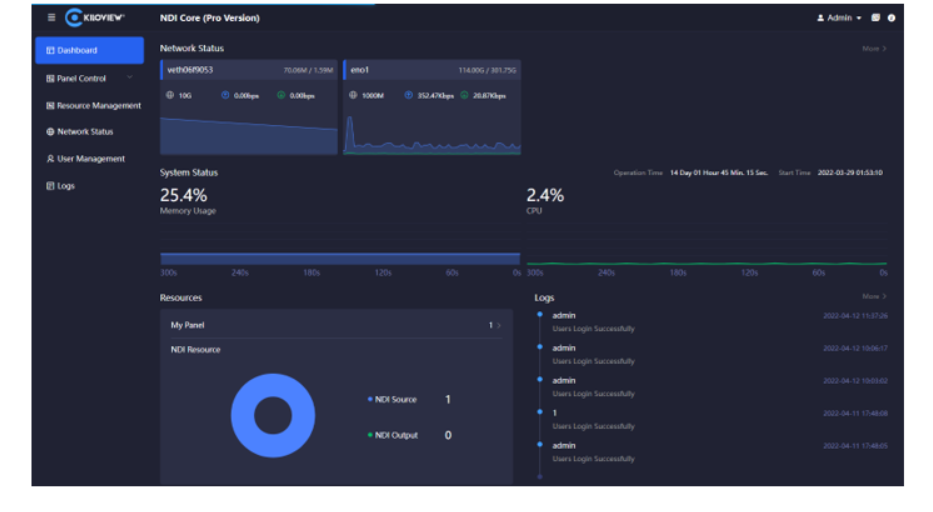
Network status:
- eno1: NIC name on the NDI CORE server
- 49.12G/1.37T: Total upstream traffic/downstream traffic of the current device
- The maximum bandwidth of the current network Real-time traffic output of the network
Real-time traffic input of the current network
Resources: displays the input sources, outputs and number of panels. - NDI Source:All user-added NDI video sources, not including those discovered but not added
- NDI Output: All user-created NDI output sources
- My Panel: The number of panels created under the user