Click “Dashboard” on the WEB page to check the system information includes network status, system status, resources and logs.
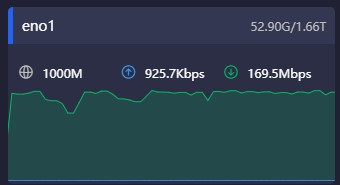
Network status
Shows all network device information and traffic statistics on the NDI server.
Introduction:
eno1:Switcher The name of the network card on the Switcher server.
59.90G/1.66T:Total upstream traffic/downstream traffic of the current device
The maximum bandwidth of the current device
:Real-time traffic output of the current device
:Real-time traffic input of the current device
System status
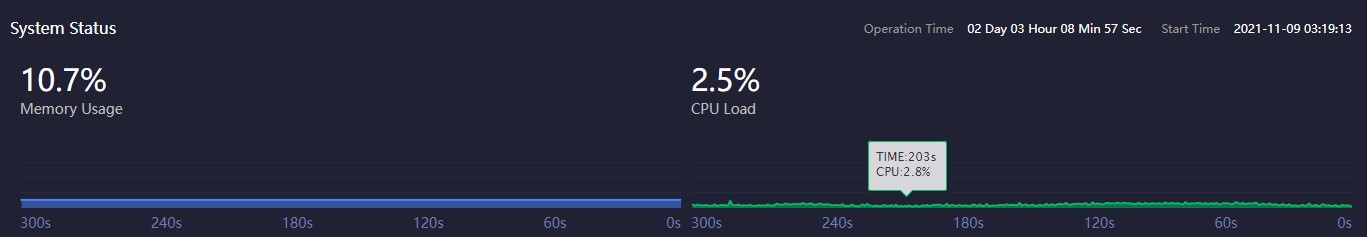
Introduction:
When the system memory and CPU are too high, please confirm whether the performance of the NDI Switcher device is insufficient due to a large number of transmissions. You may need to update your hardware system.
The time line below shows the memory and CPU usage in the past time, and the current time is 0s.
Memory Usage**:Current memory usage
CPU Load:Current CPU Load
Operation Time: Total running time of NDI Switcher system
Start Time:NDI Switcher start time
Resources
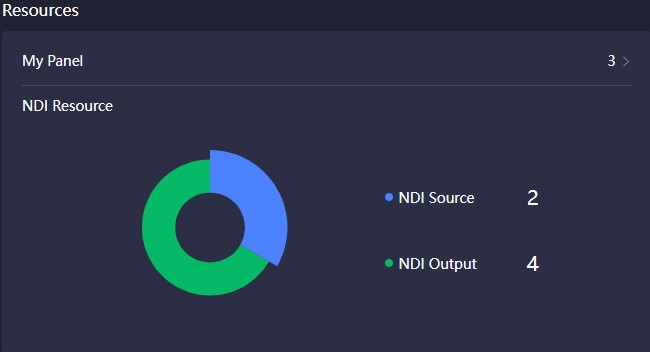
Introduction:
Total NDI input:All NDI video sources added by users, but excludes NDI video sources that are not added.
Total NDI output:All NDI output sources created by users.
My Panel:The numbers of control panels created under the current user.
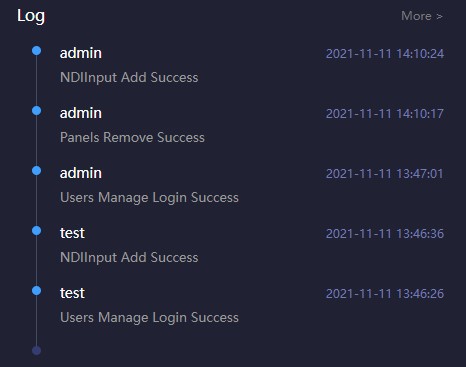
Log
Statistics of all operations on the NDI Switcher system include the time and the account of the operation, which is conducive to troubleshooting.